STOmicsDB
Spatial TranscriptOmics DataBase (STOmicsDB) is a comprehensive portal integrating spatiotemporal omics literature, tools, and data. It consists of the following sections:
Ⅰ. Datasets
1. Data Pre-processing and Analysis
We used Scanpy (version 1.8.1) with default parameters to analyze curated datasets. Key steps include:
- Normalization and Logarithmization: Gene expression data were normalized and logarithmized.
- Dimensionality Reduction: PCA was performed on the top 2000 highly variable genes.
- Clustering: UMAP and Leiden algorithm were used for clustering.
- Marker Gene Annotation: Cluster-specific marker genes were identified using the Wilcoxon rank-sum test.
- Spatial Analysis: Spatially variable genes were identified using spatialDE (version 1.1.3).
Example: For a mouse brain dataset, PCA and UMAP identified distinct cell clusters, while spatialDE highlighted spatially restricted genes.
Download Links: All data and analysis results are available in the Data and Analysis results tabs.
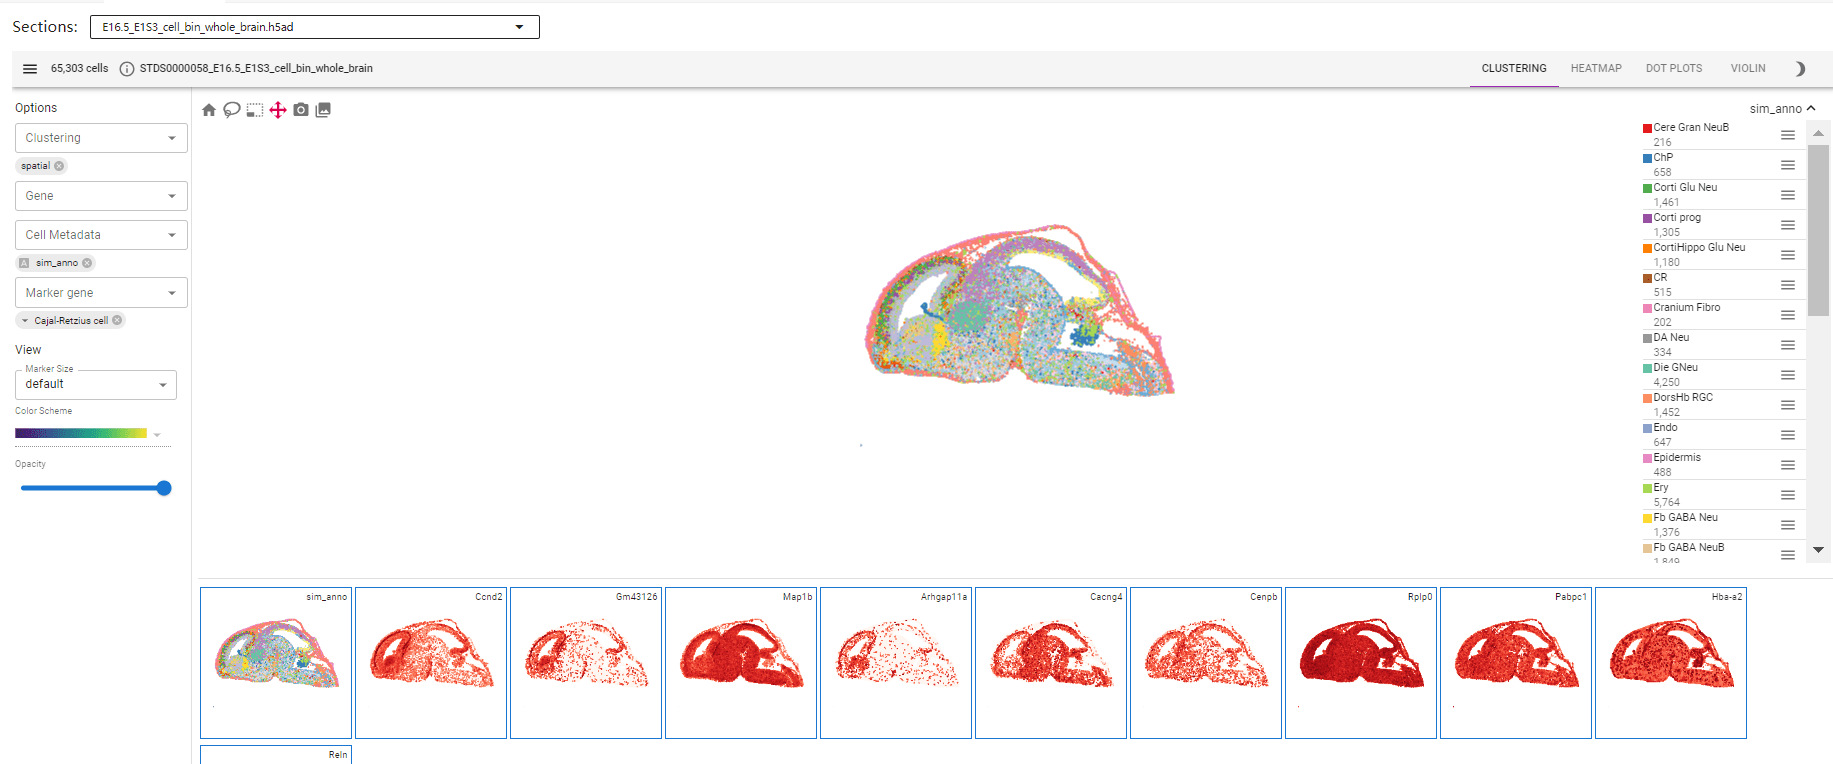
2. Data Visualization
STOmicsDB uses Cirrocumulus for interactive visualization. Key features include:
- Section Selector: Select specific dataset sections.
- Top Toolbar: Displays cell counts and includes visualization tools (e.g., embeddings, heatmaps).
- Left Sidebar: Select genes, clustering tags, and perform differential expression analysis.
- Main Canvas: Interactive 2D/3D graphics with zoom and selection.
- Gallery: Quick access to selected genes/gene sets.
Example Use Case: Visualize the expression of a specific gene (e.g., Sox2) across tissue sections.
For detailed documentation, visit Cirrocumulus Documentation.
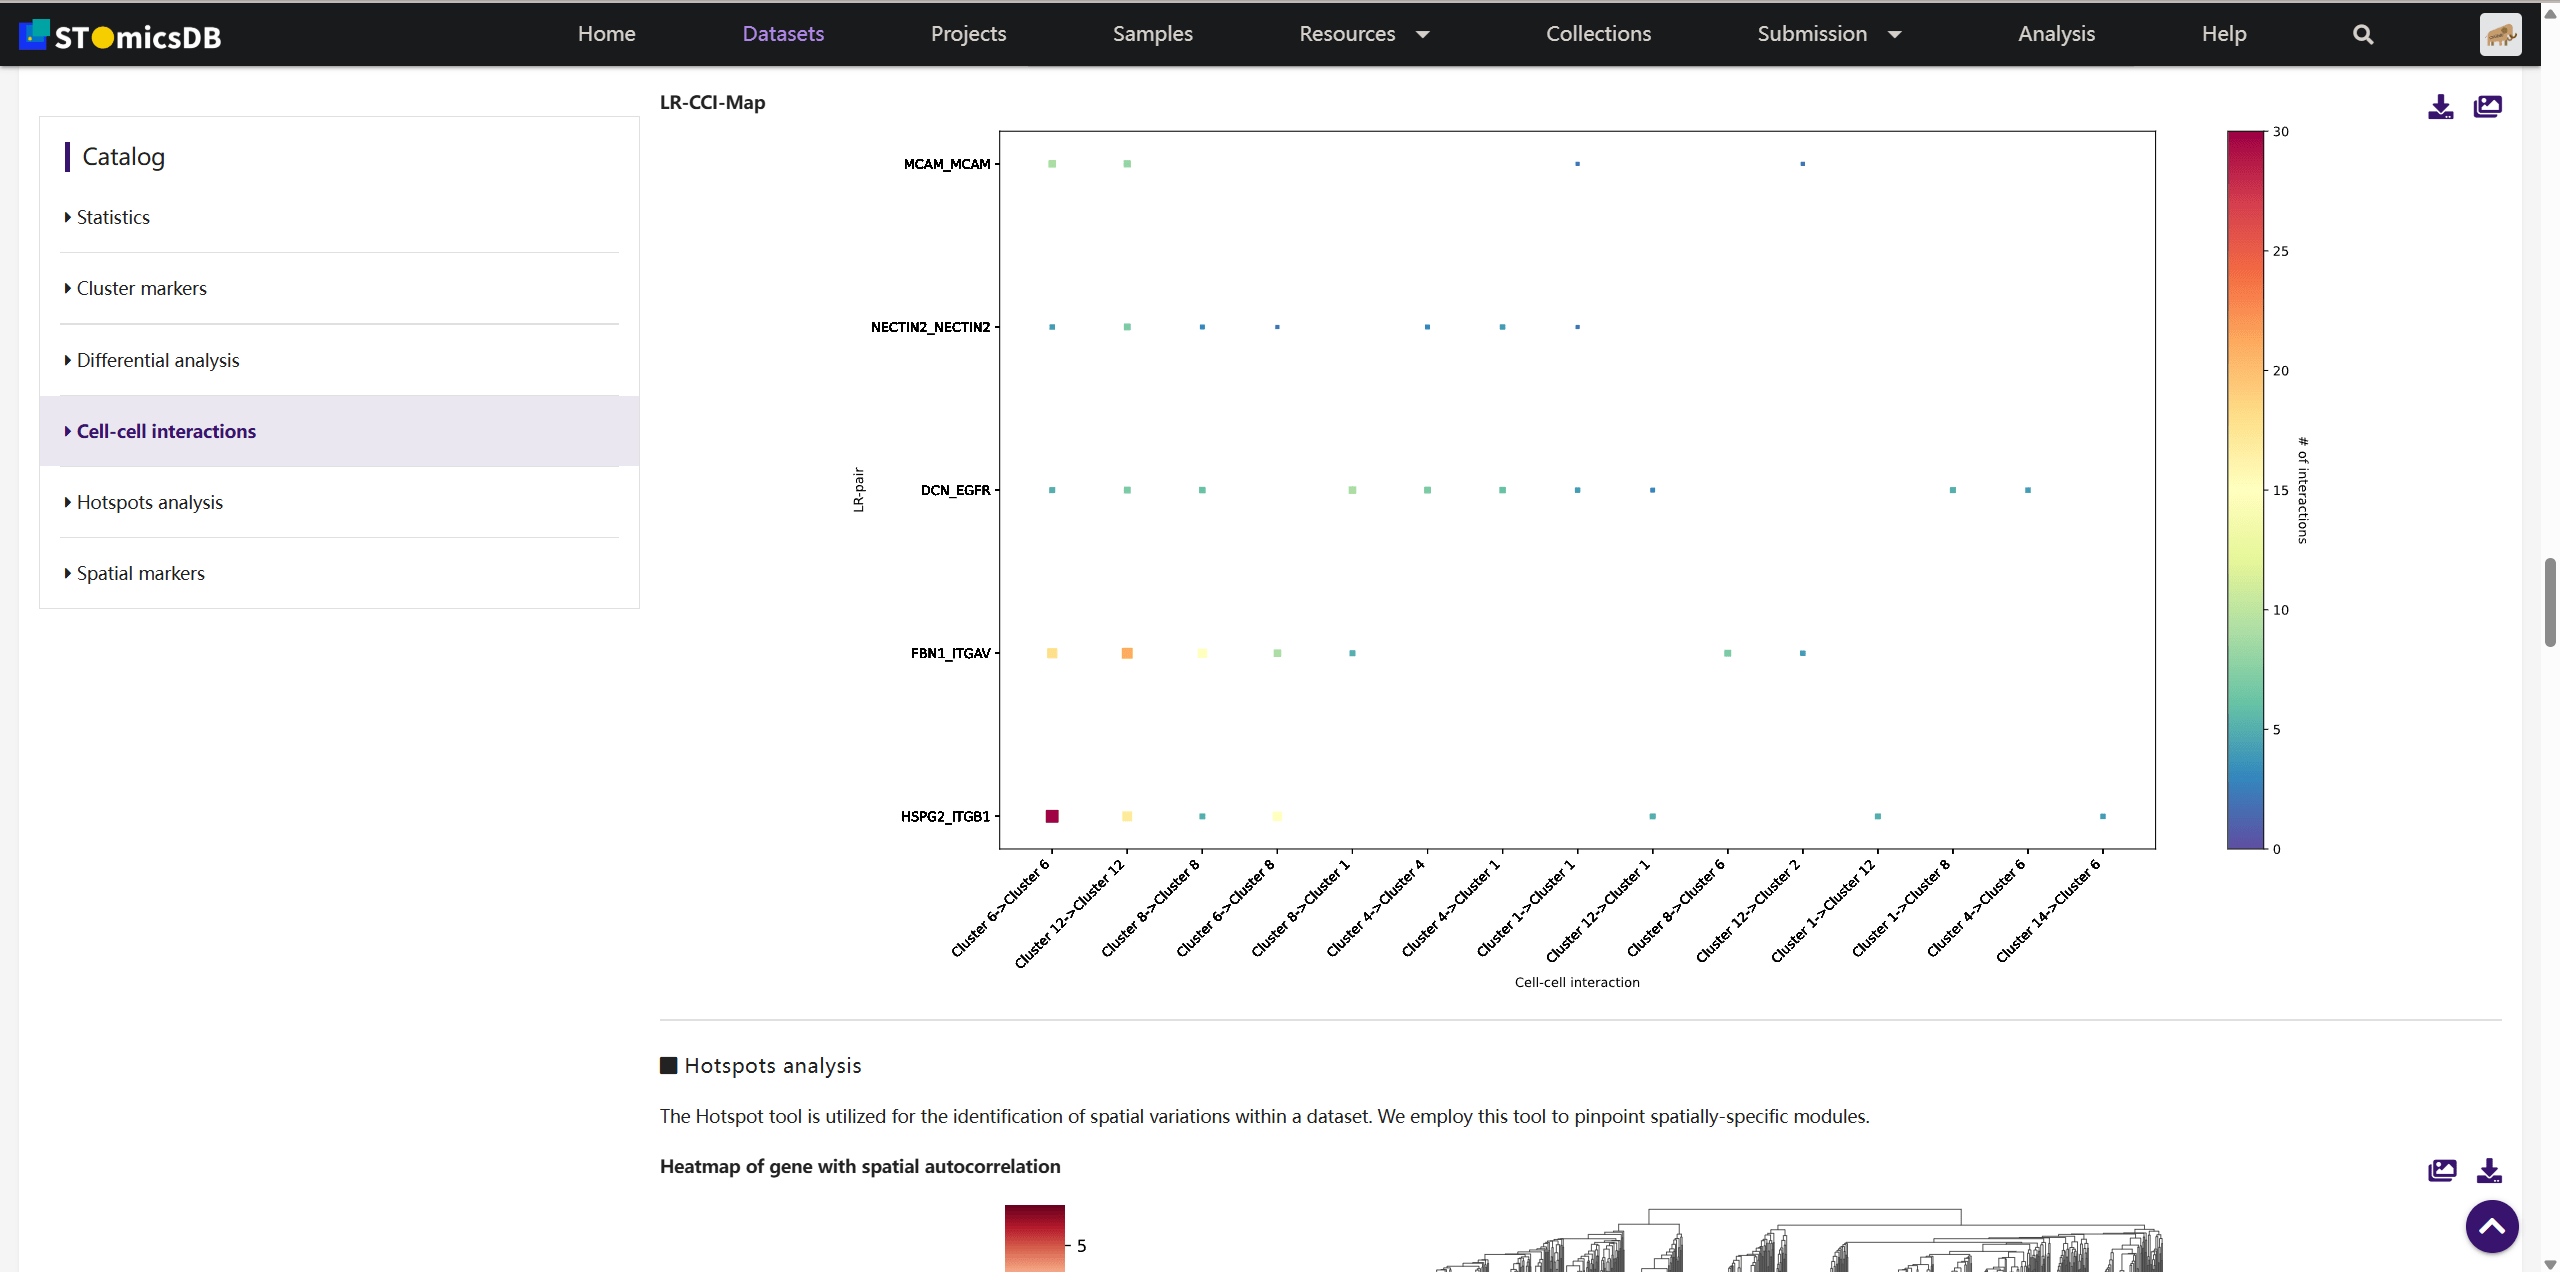
3. Dataset Analysis Results
Explore general statistics, heatmaps, cluster markers, volcano plots, GO/KEGG enrichment, cell-cell interactions, and spatially-specific modules.
Example: Use volcano plots to identify differentially expressed genes between clusters.
Ⅱ. Projects
1. Overview
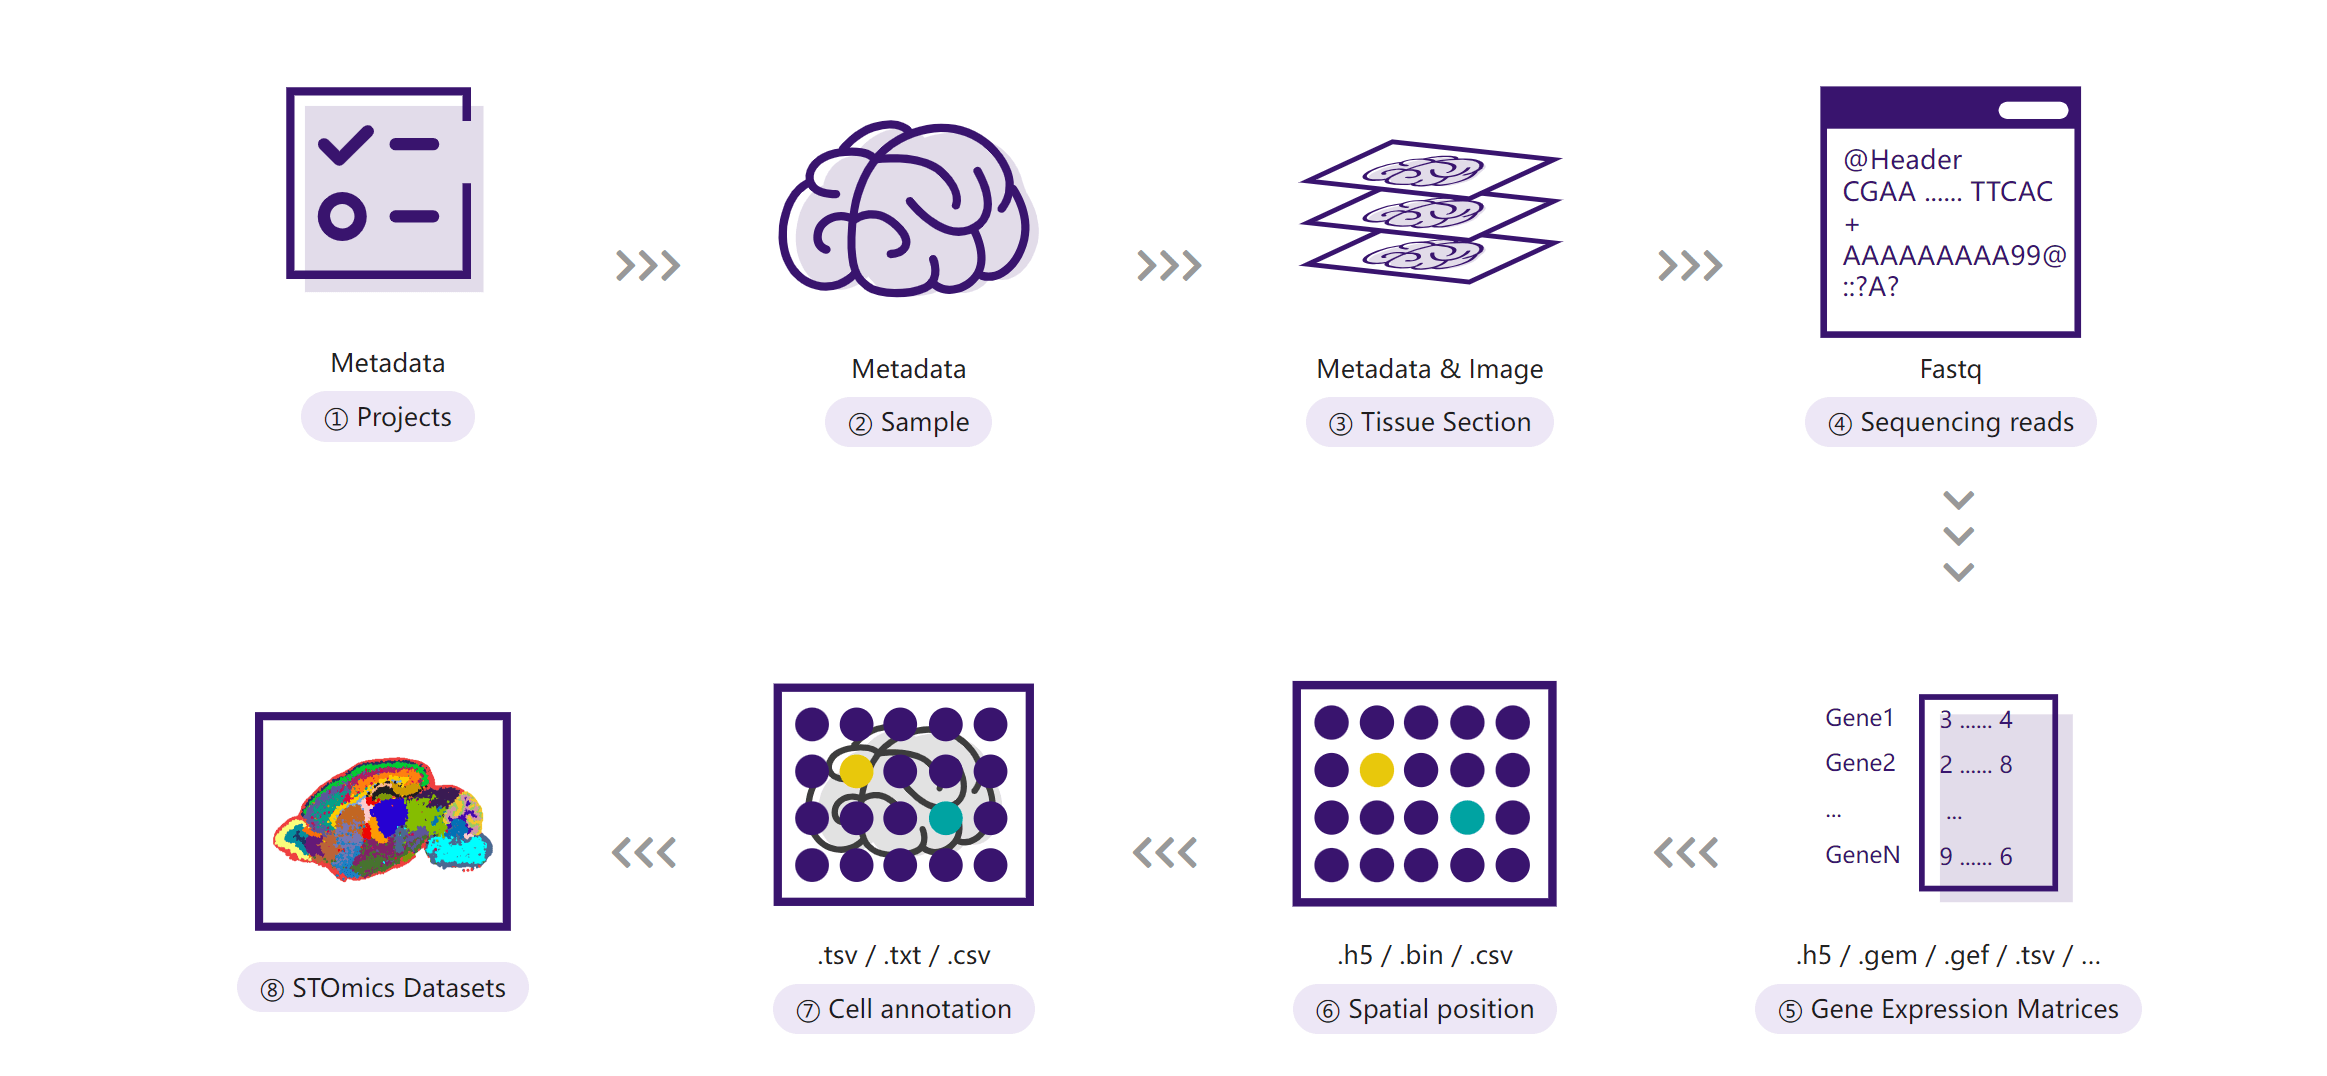
STOmicsDB provides a robust data archiving service for securely storing and sharing spatial omics data. This service supports sequencing data (e.g., FASTQ, BAM) and associated metadata, ensuring compliance with data standards.
2. Key Features
- Data Storage: Long-term preservation of raw sequencing data and metadata.
- Project Management: Organize data systematically into projects for easy access and sharing.
- Compliance: Ensures adherence to data submission standards and ethical guidelines.
- Download Support: Archived data can be downloaded for further analysis.
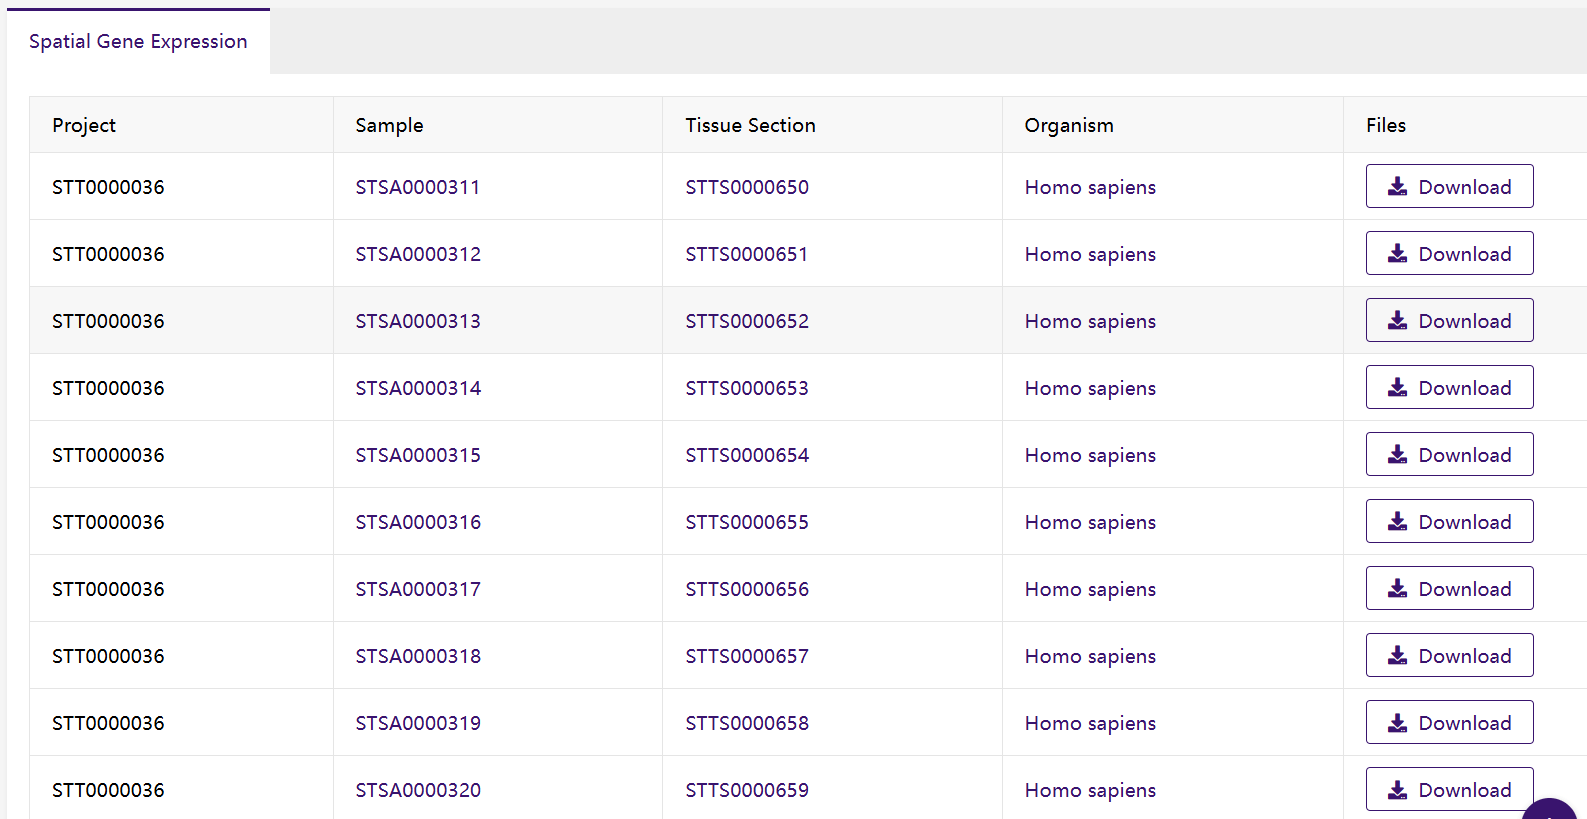
3. Project metadata display

4. Data file download
Ⅲ. Resource Center
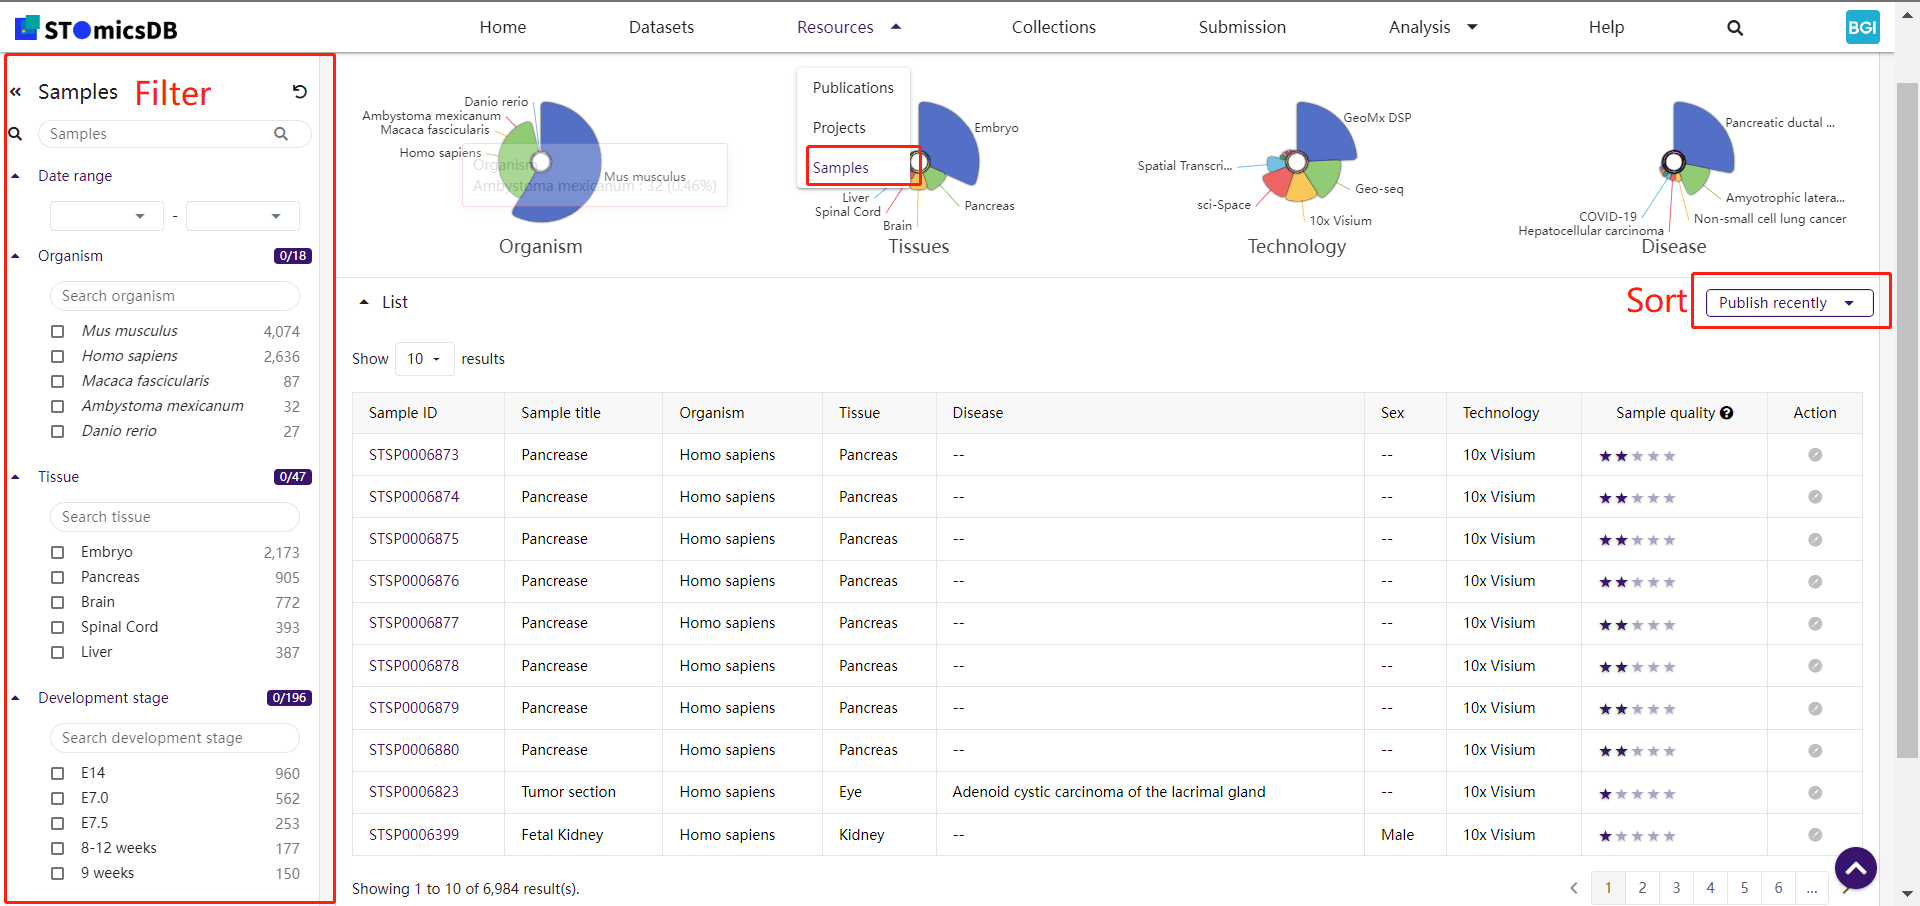
1. Samples
Search datasets using keywords and filters (e.g., species, tissue details, technologies).
Example: Search for "mouse liver regeneration" datasets.
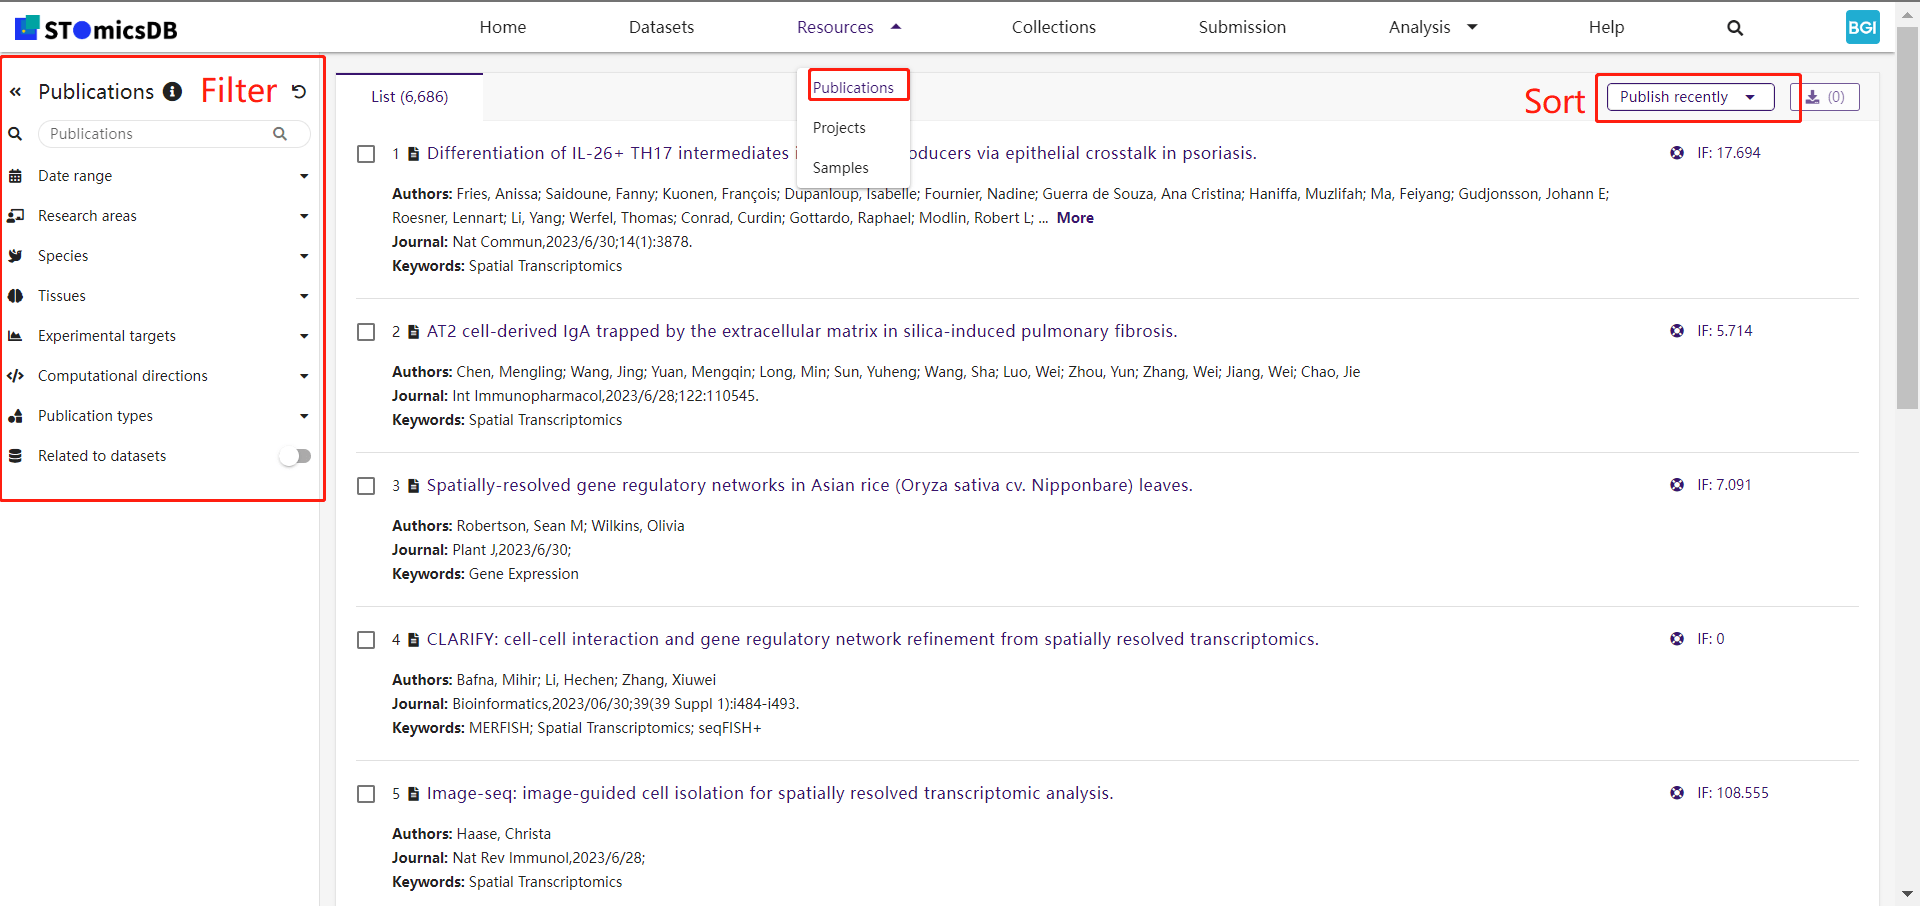
2. Publications
Search publications using keywords and filters (e.g., research areas, species).
Example: Filter publications by "zebrafish embryogenesis."
3. Collections
STOmicsDB offers customized database services. Current databases include:
- ATRISTA: Axolotl brain regeneration (Link)
- MOSTA: Mouse organogenesis (Link)
- ZESTA: Zebrafish embryogenesis (Link)
- MLRSTA: Mouse liver regeneration (Link)
Example Use Case: Use ATRISTA to explore axolotl regeneration datasets.
4. Analysis
-
SingleR
Annotate cell types by uploading single-cell RNA sequencing data. Outputs include spatial feature plots.
Example: Annotate immune cells in a tumor microenvironment dataset. -
Gene Search
Search for genes to view spatial maps across dataset sections.
Example: Search "TP53" in human datasets to explore its spatial expression. -
Compare
Compare spatial gene expression between two datasets.
Example: Compare liver regeneration datasets from mouse and human. -
Stereomap
Visualize ultra-high resolution datasets with over one million cells.
Example: Explore high-resolution spatial data from a mouse brain dataset.
Ⅳ. Service Introduction:
1. Data Archiving and Visualization Creation
STOmicsDB provides two core services designed to meet your data submission needs:
Data Archiving
- Use Case: For archiving sequencing data (e.g., FASTQ, BAM) and associated metadata.
Create projects to systematically manage data and ensure compliance with data standards. - Data Archiving Guide: Learn more here.
Data Visualization
- Use Case: For creating visualizations of expression data (e.g., gene expression matrices).
Supports generating rich visualizations (e.g., gene expression maps, clustering results, spatial annotations) and creating datasets for exploration and sharing. - Visualization Creation Guide: Learn more here.
Recommended Options
- Submitting Sequencing Data: Choose the "Data Archiving" service to securely store data and create projects.
Example Project: View here. - Submitting Expression Data: Choose the "Visualization Creation" service to generate intuitive datasets for exploration and sharing.
Example Dataset: View here. - Submitting Both Sequencing and Expression Data:
- Option 1 (Recommended): Use the "Data Archiving" service for sequencing data and the "Visualization Creation" service for expression data.
- Option 2 (Simpler): Use the "Data Archiving" service to submit both sequencing and expression data (visualization services are not provided with this option).
2. Data Archive vs. Data Visualization
| Feature | Data Archive | Data Visualization |
|---|---|---|
| Primary Purpose | 📁 Data storage and sharing | 📊 Data visualization |
| Best For | Long-term data preservation and sharing | Data visualization and exploration |
| Raw data (fq, bam) | ✅ Supported | ❌ Not supported |
| Expression Matrix | ✅ Storage only | ✅ Visualization support |
| Data Download | ✅ Supported | ✅ Supported |
| Annotation and Analysis Result Display | ❌ No visualization | ✅ Supported |
3. Submission Guidelines
Data Archive
STOmicsDB supports data submission for Stereo-seq and 10x Visium techniques. The submission process includes filling out metadata templates, uploading data files, and ensuring compliance with data standards. For step-by-step guidance, refer to the Data Archiving Help.
Submission Template: Download here.
Data Visualization
STOmicsDB provides a comprehensive guide for creating visualizations of spatial omics datasets. This includes metadata preparation, data upload, and visualization creation steps. Researchers can explore datasets through intuitive visualizations, such as gene expression maps and cell annotations. For detailed instructions, refer to the Visualization Creation Guide.
Creation Template: Download here.
Ⅴ. More About
Data Sharing Policy
STOmicsDB ensures secure and ethical data sharing through its Data Sharing Policy. It defines public and controlled data access, intellectual property rights, and compliance with legal and ethical standards. For more details, refer to the Data Sharing Policy.
Preservation Plan
STOmicsDB is committed to the long-term preservation of spatial omics data. The Preservation Plan outlines protocols for data archiving, security, and migration to ensure data accessibility and integrity over time. For more information, refer to the Preservation Plan.
How to Cite
The following are examples of a STOmicsDB dataset reference description:
- The stereo-seq data used to generate Fig. 1 comes from the STOmicsDB database[1], query number STDS0000058[2].
- The spatial mouse kidney data have been deposited into STOmicsDB[1](https://db.cngb.org/stomics/datasets/STDS0000058[2]).
Examples of citing STOmicsDB, datasets, and original data article:
- Database Citation:
[1] Xu, Zhicheng et al. “STOmicsDB: a comprehensive database for spatial transcriptomics data sharing, analysis and visualization.” Nucleic Acids Research, vol. 52, D1 (2024): D1053-D1061. doi:10.1093/nar/gkad933 - Visualization Dataset:
[2] Longqi Liu. MOSTA: Mouse Organogenesis Spatiotemporal Transcriptomic Atlas[DS/OL]. STOmicsDB, 2021[2021-10-22].https://db.cngb.org/stomics/datasets/STDS0000058/. doi:10.26036/STDS0000058 - Original Data Article:
Chen, Ao et al. “Spatiotemporal transcriptomic atlas of mouse organogenesis using DNA nanoball-patterned arrays.” Cell, vol. 185, 10 (2022): 1777-1792.e21. doi:10.1016/j.cell.2022.04.003
Contact
For assistance, contact P_STOmicsDB@genomics.cn.
We provide detailed guidance and support to ensure a smooth process for data submission and visualization creation.
Support Hours: Monday to Friday, 9:00 AM - 6:00 PM (GMT+8).