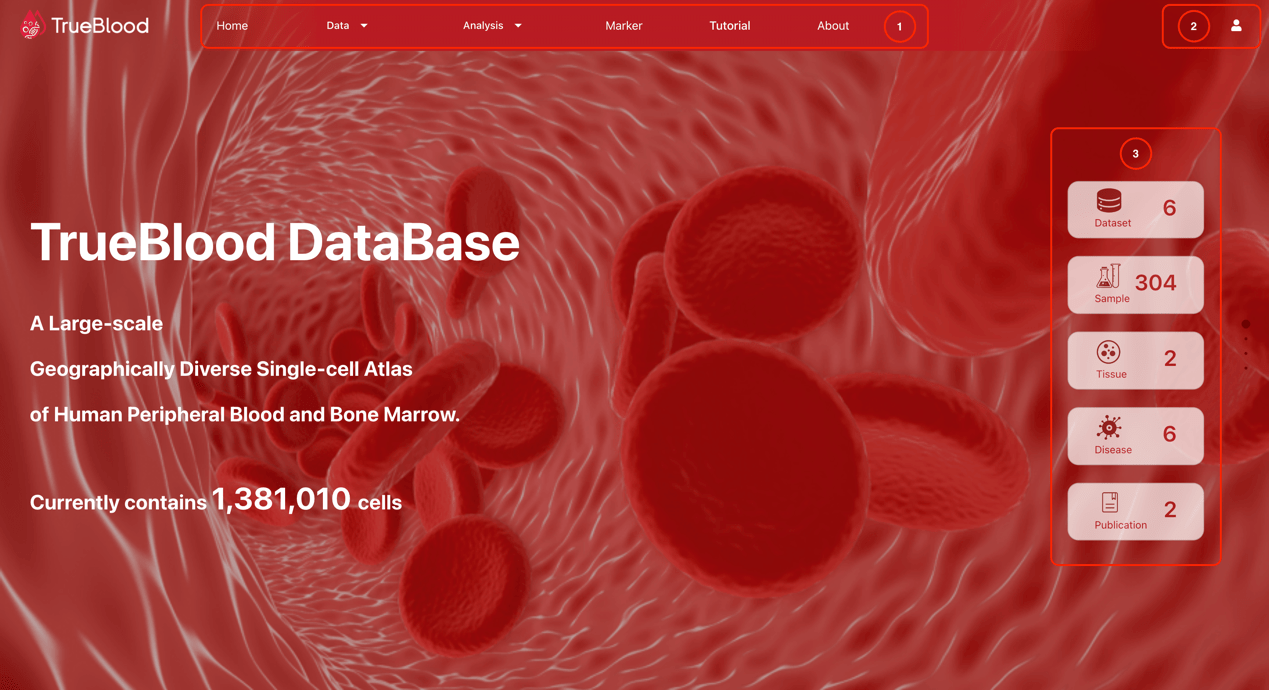
HomePage
Users can see the total number of cells, datasets, sample sources, sample status, and published papers in all datasets currently included in the database on the homepage. Users can click on the corresponding tab to jump to it.
- Top navigation bar
- Login button
- Statistical information label
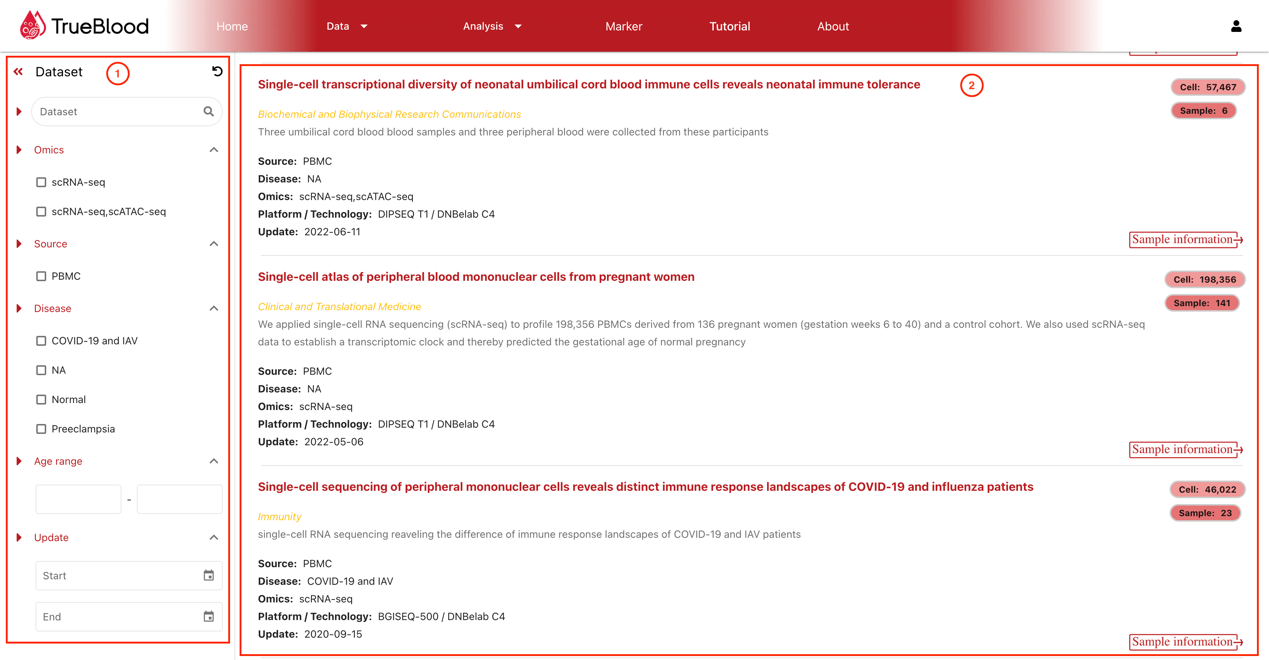
Datasets
Users can enter from the "Dataset" tab on the homepage or click on "Dataset" from the submenu under the "Data" tab on the top navigation bar.


- Dataset filtering area
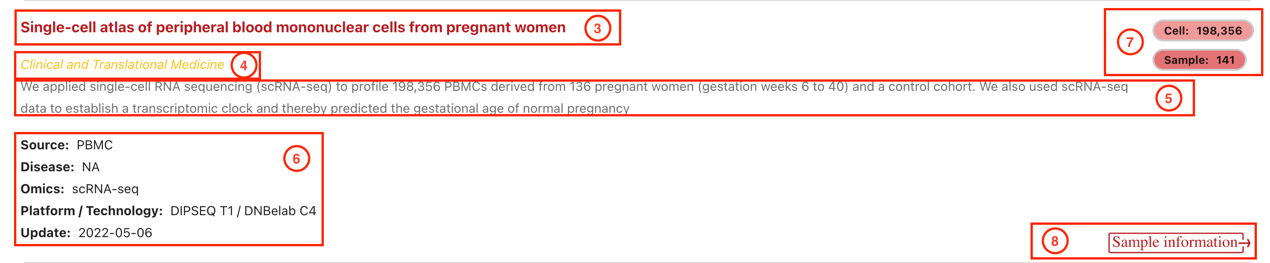
- Dataset list
- Dataset title
- Dataset published journal
- Dataset overall design
- Dataset basic information
- Dataset total cell count and sample size
- Dataset sample information jump button
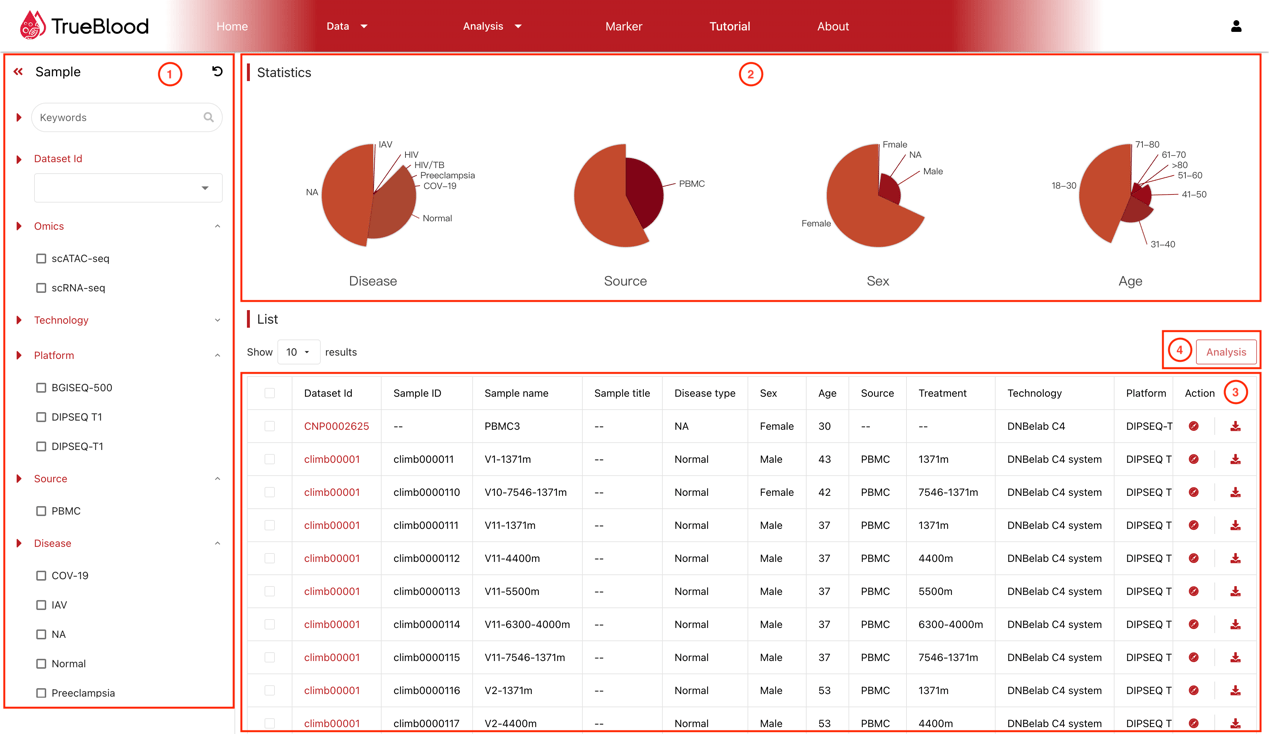
Sample
Users can enter from the "Sample" tab on the homepage or click on "Dataset" from the submenu under the "Data" tab on the top navigation bar. By default, all sample information statistical results are displayed, and can be filtered based on conditions. The statistical chart will be updated in real-time; Check the samples in the list and click the analysis button to perform a combined analysis of multiple samples.


- Dataset filtering area
- Sample information statistical chart
- Sample information table
- Analysis button
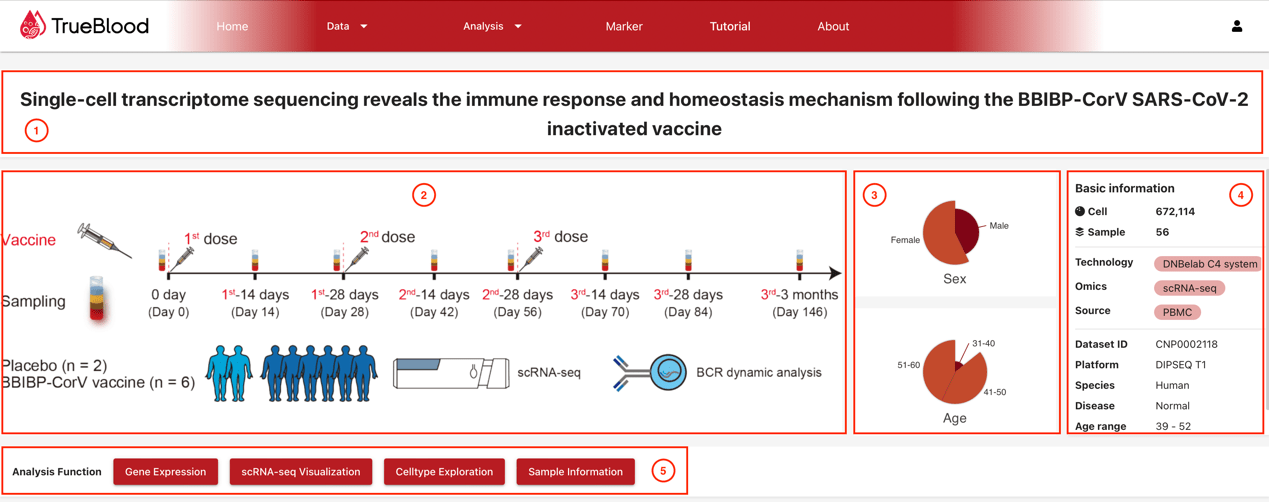
Dataset Detail Pages
- Dataset title
- Dataset graphic abstract
- Dataset sample gender and age statistical chart
- Dataset basic information
- Analysis function jump button
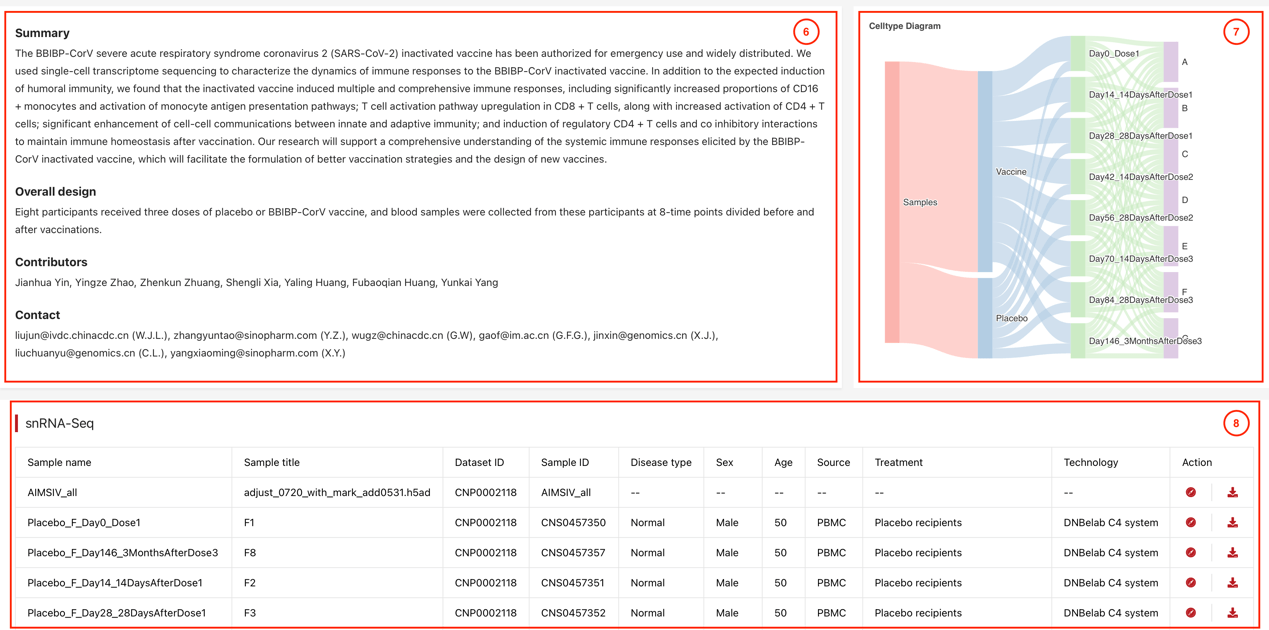
- Dataset summary, experimental design, author
- Dataset experimental design structure chart
- Sample information table
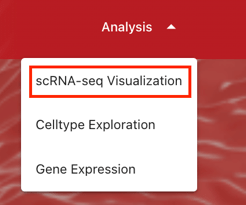
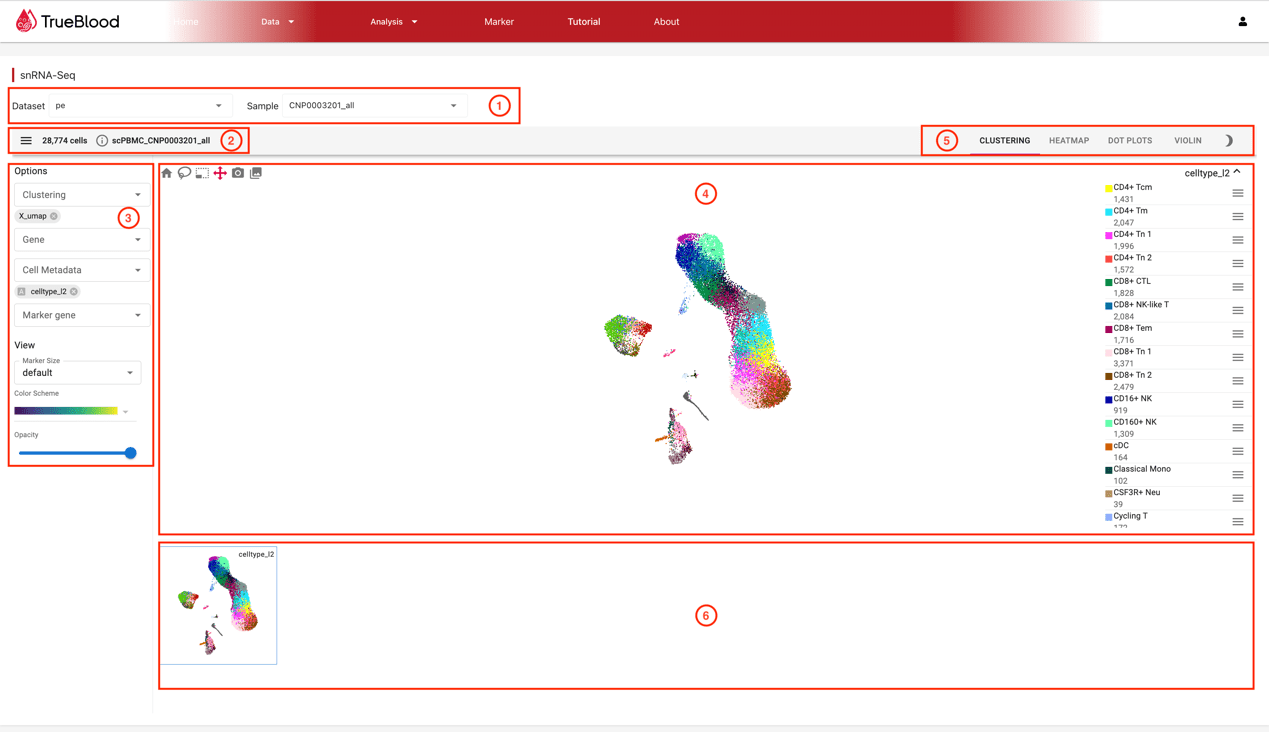
scRNA-seq Visualization
The scRNA-seq Data and information visualization interface can be jumped from the "scRNA-seq Visualization" button on the dataset page, or you can click "scRNA-seq Visualization" from the submenu under the "Analysis" tab on the top navigation bar.
This visualization tool allows users to freely explore the results of dataset analysis, draw gene expression heatmaps, point maps, violin maps, and more.
- Dataset&Sample Selection Bar
- Current Visualization Information
- Visualization Parameter Adjustment Area
- Visualization Display Area
- Visualization Function Selection Area
- Visualization Result Saving Area
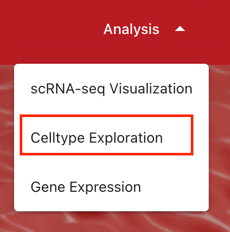
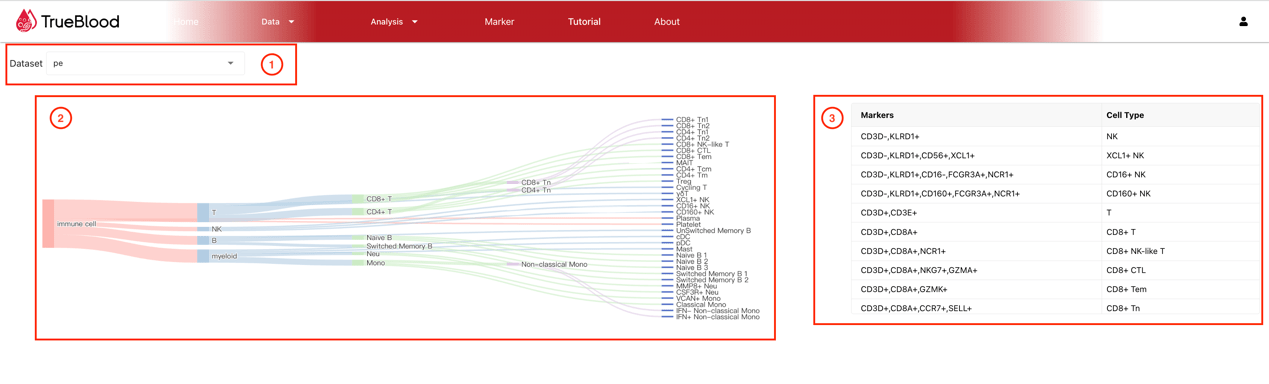
Celltype Exploration
The celltype exploration page can be accessed from the "Celltype Exploration" button on the dataset page, or by clicking on "Celltype Exploration" from the submenu under the "Analysis" tab in the top navigation bar. This page displays the cell type structure tree of the selected dataset, as well as the annotated cell type Marker table. It can also display a column chart of cell number and cell proportion based on grouping information.
- Dataset selection column
- Celltype structure tree
- Celltypes and Markers
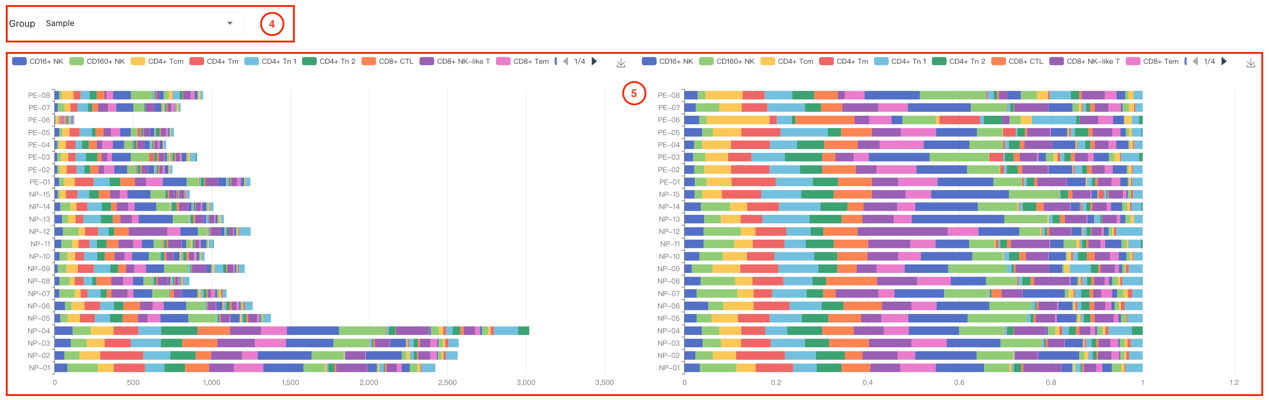
- Grouping selection column
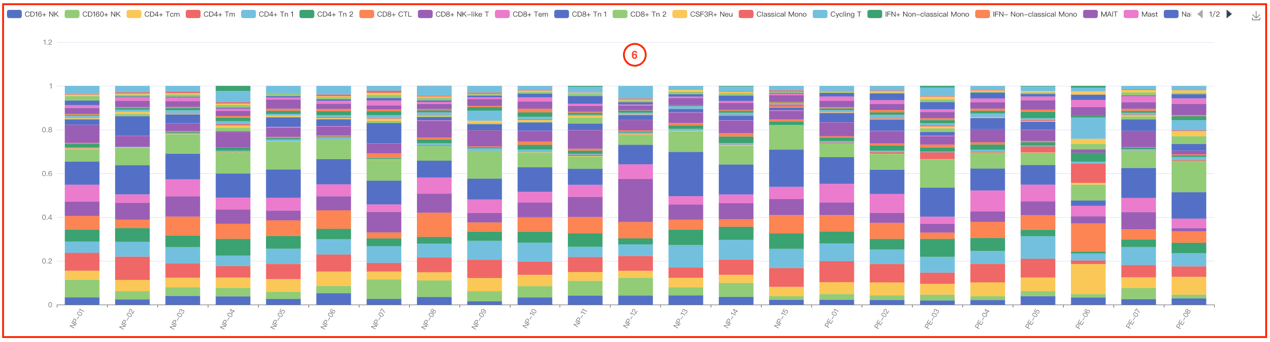
- Cell number bar chart (left) and cell proportion bar chart (right) displayed by grouping
- Cell proportion bar chart with sample as dimension
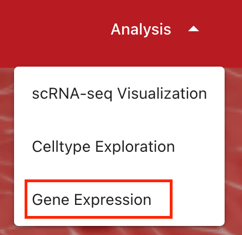
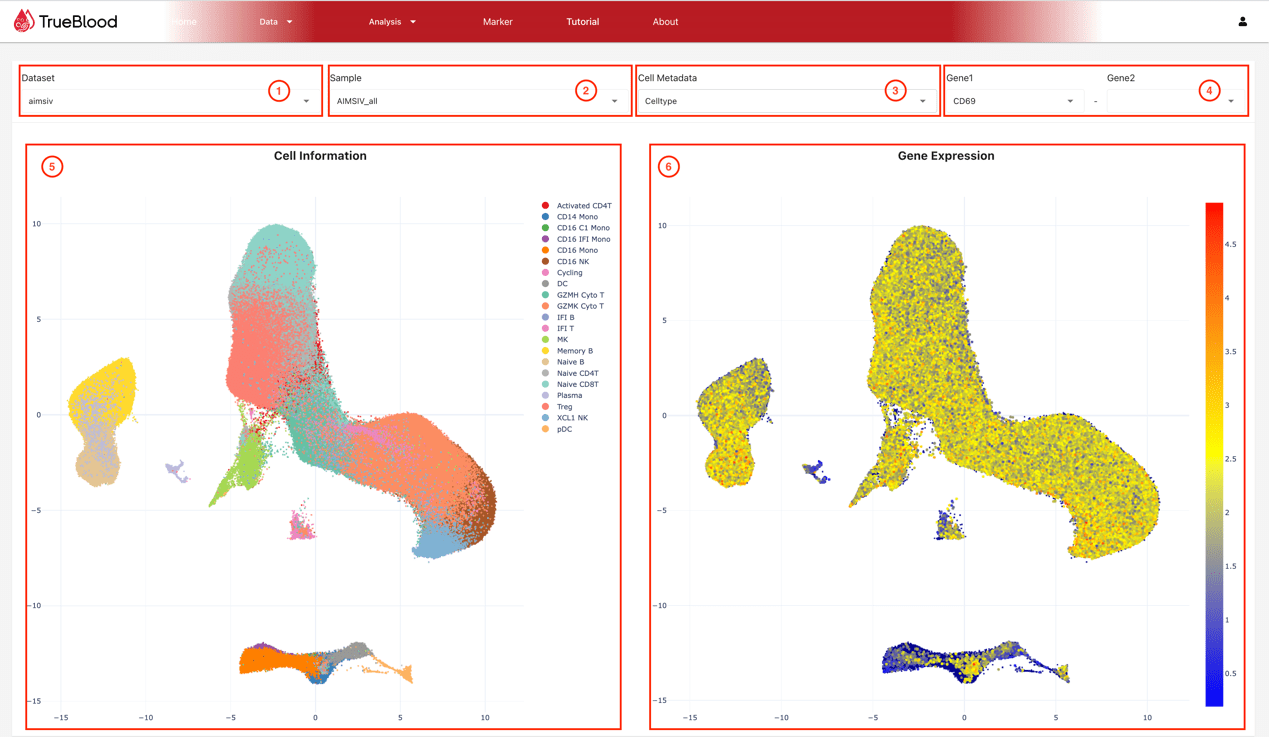
Gene Expression
The gene expression exploration page can be accessed by clicking on the "Gene Expression" button on the dataset page, or by clicking on "Gene Expression" from the submenu under the "Analysis" tab on the top navigation bar. Users can select datasets, samples, metadata information, and genes to draw corresponding UMAP maps, explore the distribution and expression of UMAP with single or double gene co expression, and draw violin maps.
- Dataset selection column
- Sample selection column
- Metadata information selection column
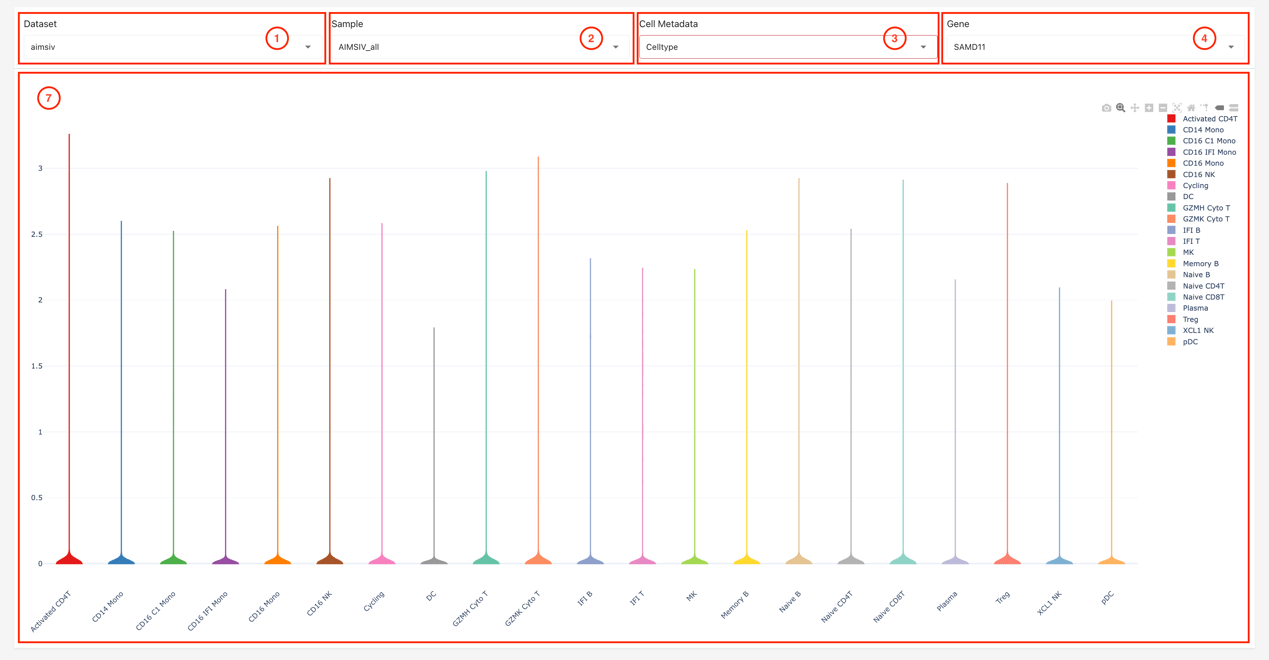
- Single gene selection or dual gene co expression selection column
- UMAP display based on metadata information
- UMAP display of gene expression
- Violin chart display of gene expression
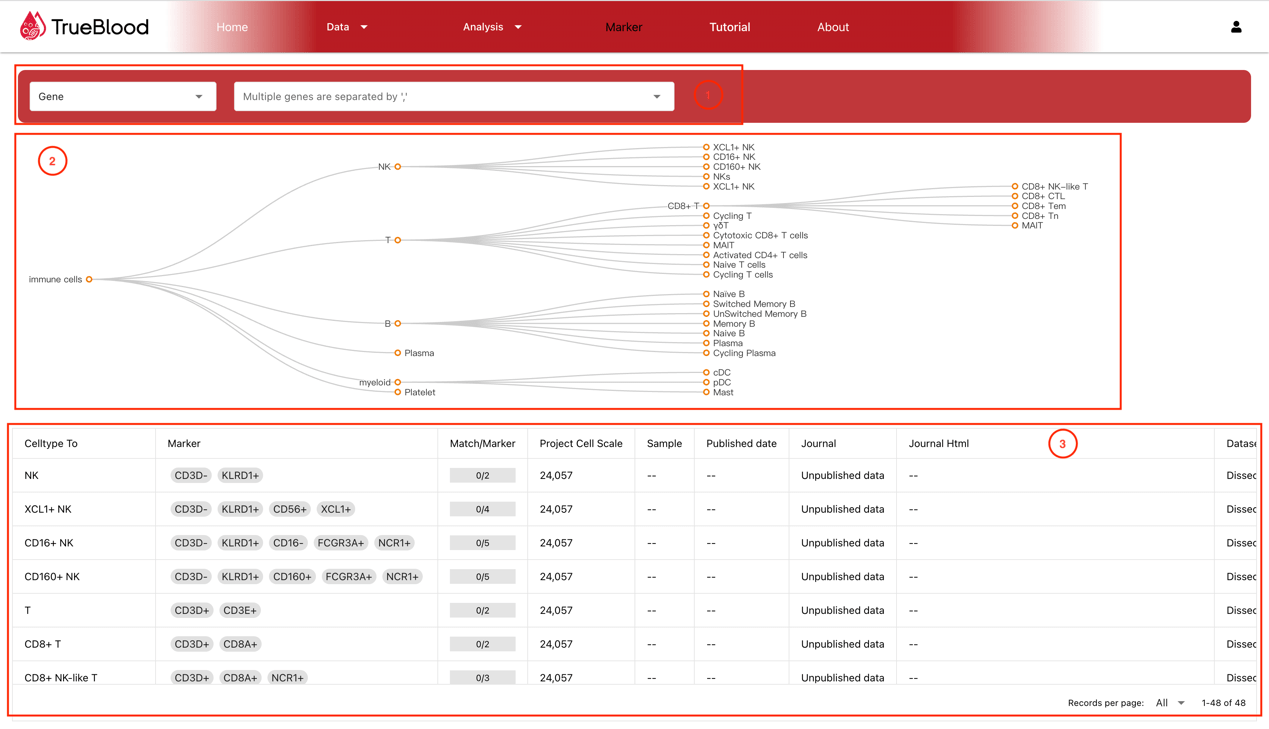
Marker
The Cell Annotation Marker search page can be accessed from the top navigation bar 'Marker'. After selecting 'Gene', a gene list can be entered, with multiple genes separated by ','. The database will match the Markers of all datasets and sort the results according to 'Match/Input' and 'Match/Marker'. Priority will be given to the cell types that match the most finely matched input gene list. The Marker genes on the match will be highlighted, and the cell structure tree will be displayed based on the matching results. You can also select 'Celltype' and enter the cell type for search, and the results will display Marker information for the matching cell type.
- "Gene/Celltype" selection and input fields
- Cell structure tree
- Marker information table