Abstract
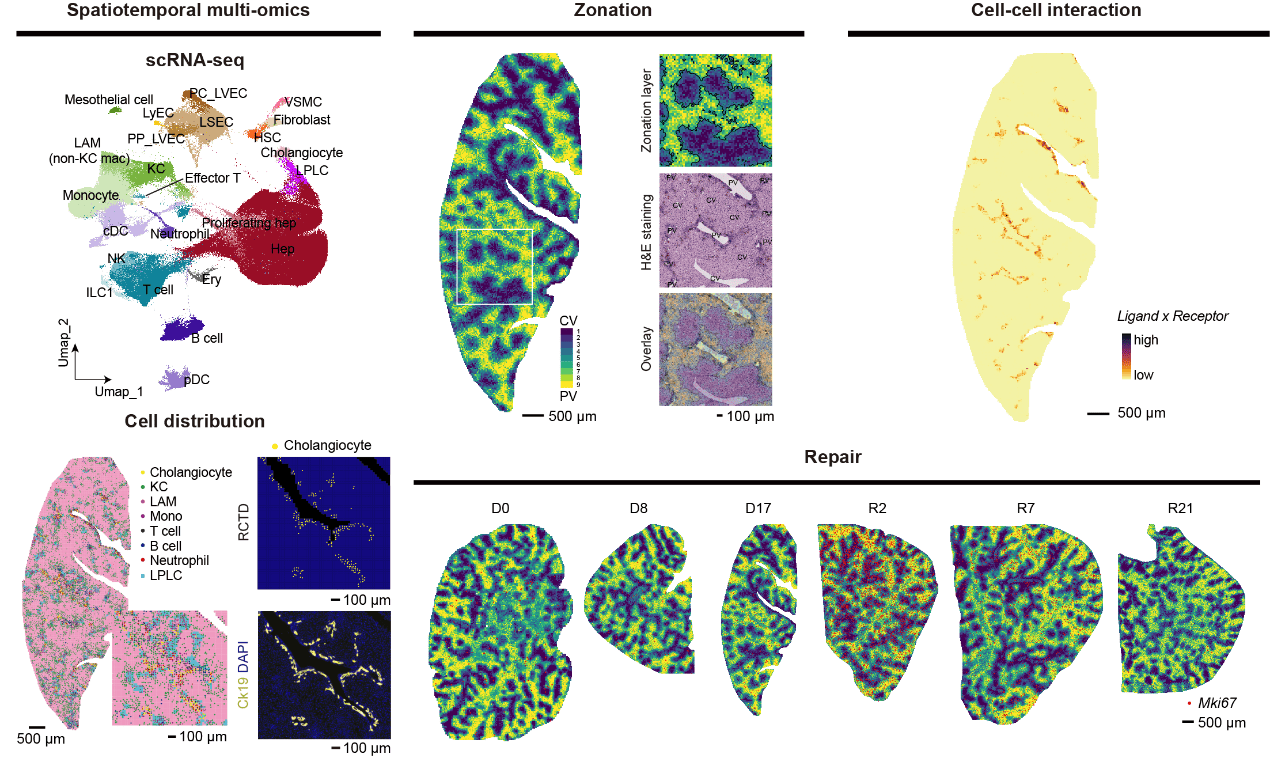
Cholestatic injuries, characterized by regional damage around the periportal region, lack curative therapies and cause considerable mortality. In this study, we generated a high-definition spatiotemporal atlas during cholestatic injury and repair by Stereo-seq and single-cell transcriptomics. We uncovered that cholangiocytes function as a periportal hub (cholangio-hub) by integrating multiple signals with neighboring cells. Feedback between cholangiocytes and lipid-associated macrophages (LAM) was detected in the cholangio-hub, which is related to the differentiation of LAM, a recently identified subpopulation of macrophages crucial in tissue injury. Moreover, the cholangio-hub highly expressed TGFβ, which is associated with cholangiocyte conversion of liver progenitor-like cells during injury and dampened proliferation of periportal hepatocytes during recovery. Importantly, spatiotemporal analysis revealed a key inhibitory rheostat for hepatocyte proliferation. Our data provide a comprehensive resource for demarcating regional cholestatic injuries.
Interactively exploring the data

Spatial clustering
22 slides of livers from six time points across DDC injury and repair stages (two mice per time point) were sequenced by Stereo-seq. We aggregated the datasets of individual sections into bins (50 × 50 DNA nanoballs per bin, 25 μm in diameter). In the Spatial clustering tab, the Stereo-seq bins are plotted by their position in each slide.
-
We provide different spatial object in File name:
- Gene expression object: allStage_display.expression.h5ad
- Ligand-Receptor pairs object: allStage.magic_LRdisplay.expression.h5ad
- Other single slide object: other *.h5ad
-
Bins can be clustered differently by selecting different classification in Metadata:
- Layer: rank
- Slide: sample and slide
- Biological replicants: mouse
- Time: group
-
Bins can be colored differently by entering gene name of interest in Gene or selecting different module
score in Metadata:
- Gene expression: “gene name”
- Ligand-Receptor: “ligand-receptor name”
- Cell score: “Cell type name”
- Injury module score: “Injury name”
And we provided quantitative comparison based on above classification by using Heatmap, Dot plots or Violin plots.

scRNA-seq
Our scRNAseq dataset is sequenced at six time points after DDC injury and repair. In the scRNA-seq tab, data are presented in both UMAP plot and gene plot modes.
-
Cells in the UMAP can be clustered differently by selecting different classification in Metadata:
- Library: lib
- Time: time
- Basic cellular annotation: annotation
-
Hepatocyte can be further explored by selecting their detail annotations in Metadata:
- anno_Hepzone, - anno_LPLCsubtype, - Heprank or - Hepzone.
Bins can be colored by their expression level of any gene of interest. And we provided quantitative comparison based on above classification using Heatmap, Dot plots or Violin plots.

Download
Access available processed data and metadata.
How to cite
