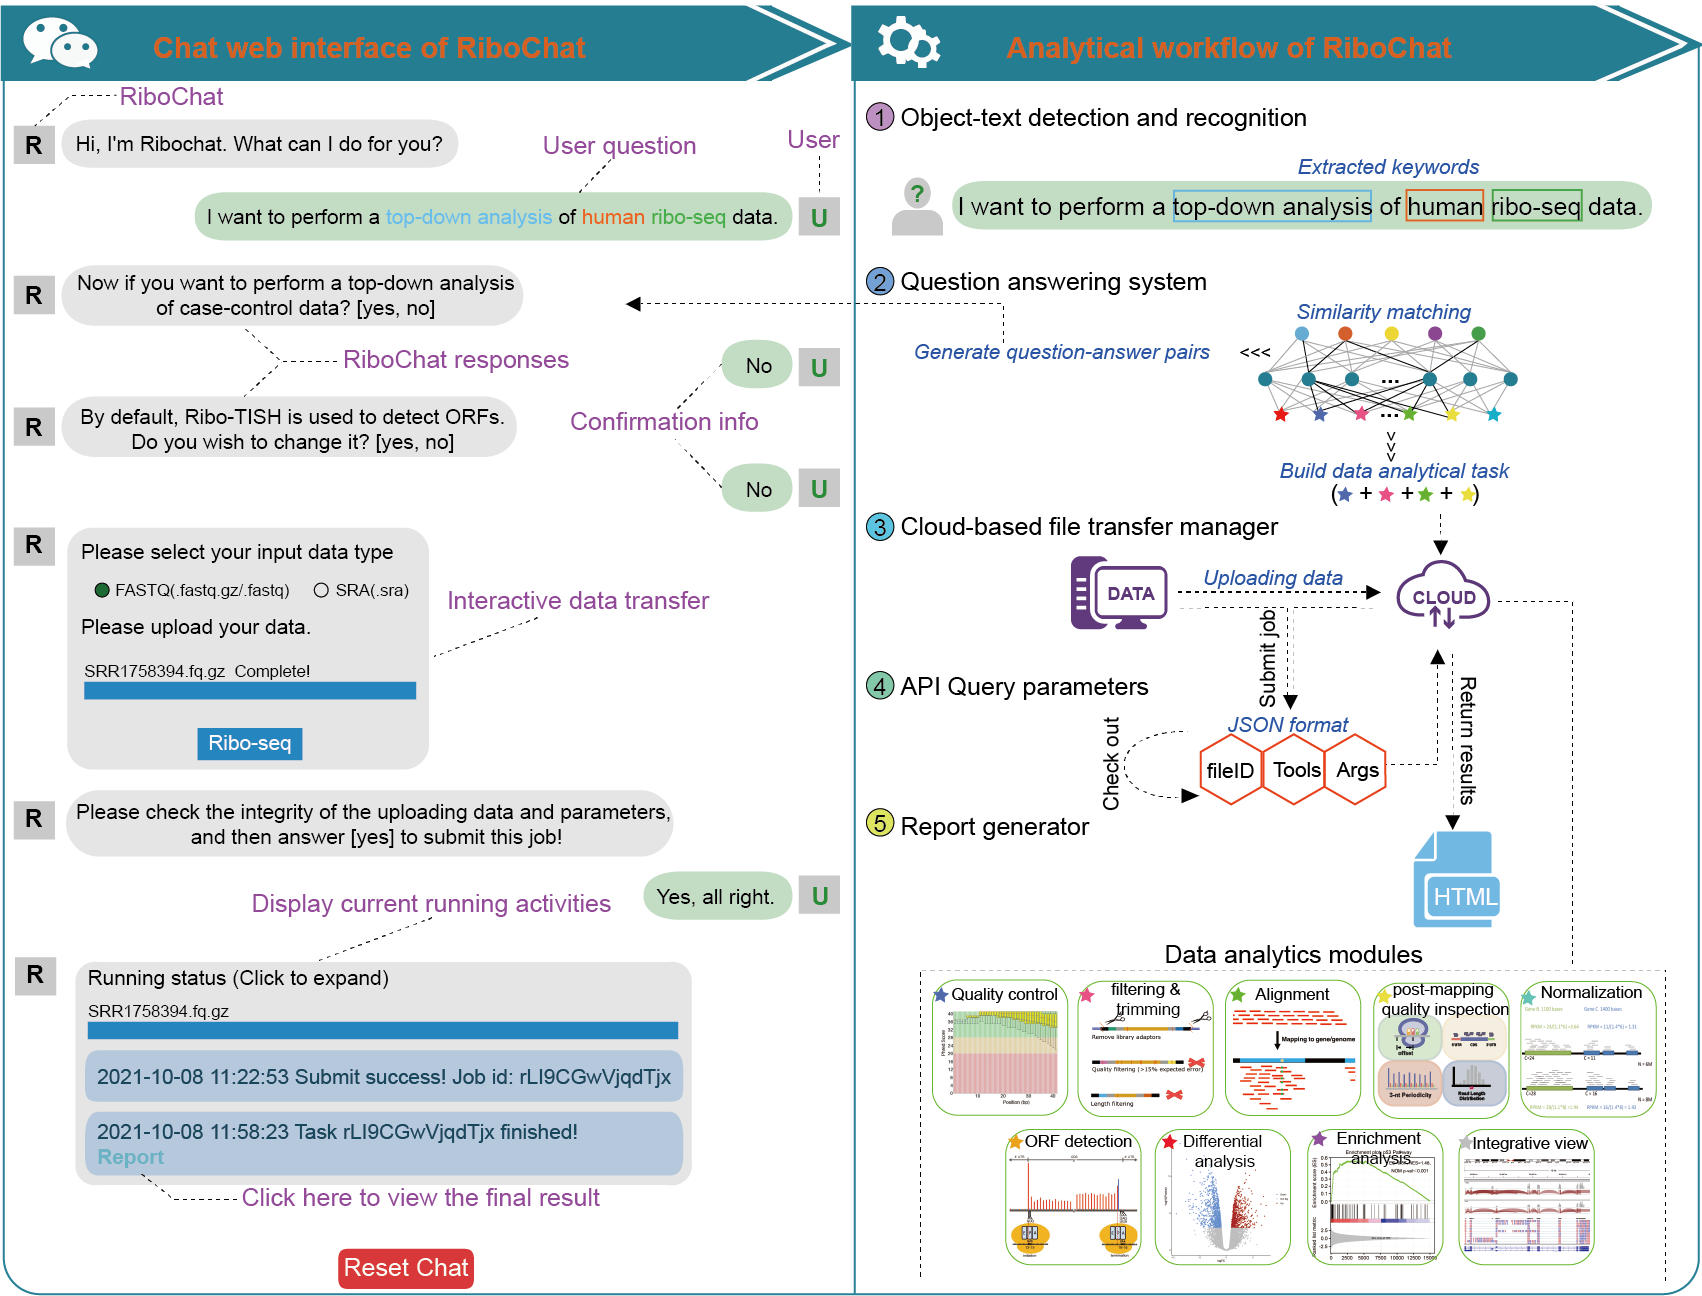
Q1. What is the logical structure of RiboChat?
The hierarchy of RiboChat logical structures is shown in below figure.
Q2. What is Ribosome Profiling?
Ribosome profiling or Ribo-seq, based on deep sequencing of ribosome-protected mRNA footprints, enables genome-wide investigation of in vivo translation at sub-codon resolution.
Q3. What formats of data do it accept?
It only accepts files in the commonly used text-based formats FASTQ, gz-compressed FASTQ, and SRA-compressed FASTQ as input. Otherwise, RiboChat will prompt the dataformat error. Notably, acceptable data is NOT allowed to include ‘.’ in filename. For instance, filename.fq.gz is right format, whereas file.name.fq.gz is wrong format.
Q4. What species include?
Currently, there are 17 species, including 10 eukaryotes - Arabidopsis, African clawed frog, Chicken, Fruit fly, Human, Rat, Mouse, Worm and Zebrafish; and 7 prokaryotes - B. subtilis, E. coli K12, E. coli Sakai, H. salinarum, P. aeruginosa, P. fluorescens, S. enterica and S. albidoflavus.
Q5. How many analytical pipelines are provided?
RiboChat currently enables to perform quality check, post-mapping quality inspection, expression quantitation, detection of translated ORFs, differential translation analysis, enrichment analysis and top-down analysis. A detailed explanation of each pipeline is summarized below.
Q6. What is quality check?
The pipeline is to perform classical quality control checks on raw sequence data that allows users to assess the overall quality of the sequence reads. To do so, FastQC is preinstalled here.
Q7. What is post-mapping quality inspection?
The pipeline is to perform specific quality control checks on ribo-seq data after mapping, including read length and biotype-specific statistics as well as abundantly mapped positions. To do so, RiboseQC is preinstalled here.
Q8. What is expression quantitation?
The pipeline is to aggregate raw counts of mapped reads using featureCounts, and further to normalize read counts for each gene or isoform as RPKM, FPKM, and TPM.
RPKM - the reads per kilobase per million mapped reads
FPKM - fragments per kilobase per million mapped reads
TPM - transcripts per million
Q9. What is detection of translated ORFs?
The pipeline is to detect actively translated regions on the basis of the characteristic three-nucleotide periodicity of ribo-seq data. To do so, Ribo-TISH, ORFquant, RiboCode and PRICE are preinstalled here. Notably, Ribo-TISH is used as the default method.
Ribo-TISH, as named Ribo TIS Hunter, is used for identifying translation activities using ribo-seq data. It assesses the significance of translation activities using multiple statistical tests. Briefly, it captures significant TISs using negative binomial test, and frame biased open reading frames (ORFs) using rank sum test (Nat Commun 2017, doi: 10.1038/s41467-017-01981-8).
ORFquant, is used for splice-aware detecting and quantifying ORF translation using ribo-seq data. It consists of transcript filtering, de-novo ORF finding, ORF quantification and ORF annotation (Nat Struct Mol Biol. 2020, doi: 10.1038/s41594-020-0450-4).
RiboCode, is used for the de novo annotatation and characterization of the full translatome by quantitatively assessing the 3-nt periodicity (Nucleic Acids Res. 2018, doi: 10.1093/nar/gky179).
PRICE, as named Probabilistic inference of codon activities by an EM algorithm, is used for resolving overlapping sORFs and non-canonical translation initiation by modeling the experimental noise (Nat Methods 2018, doi: 10.1038/nmeth.4631).
Q10. What is differential translation analysis?
The pipeline is to quantitative changes in translation or translational efficiency between different experimental groups. DESeq2 and Xtail are preinstalled here, and notably, the former is used as the default method.
Q11. What is enrichment analysis?
The pipeline is to unveil biological functions and pathways of differential translation genes. Here clusterProfiler 4.0 is preinstalled to perform functional enrichment analysis.
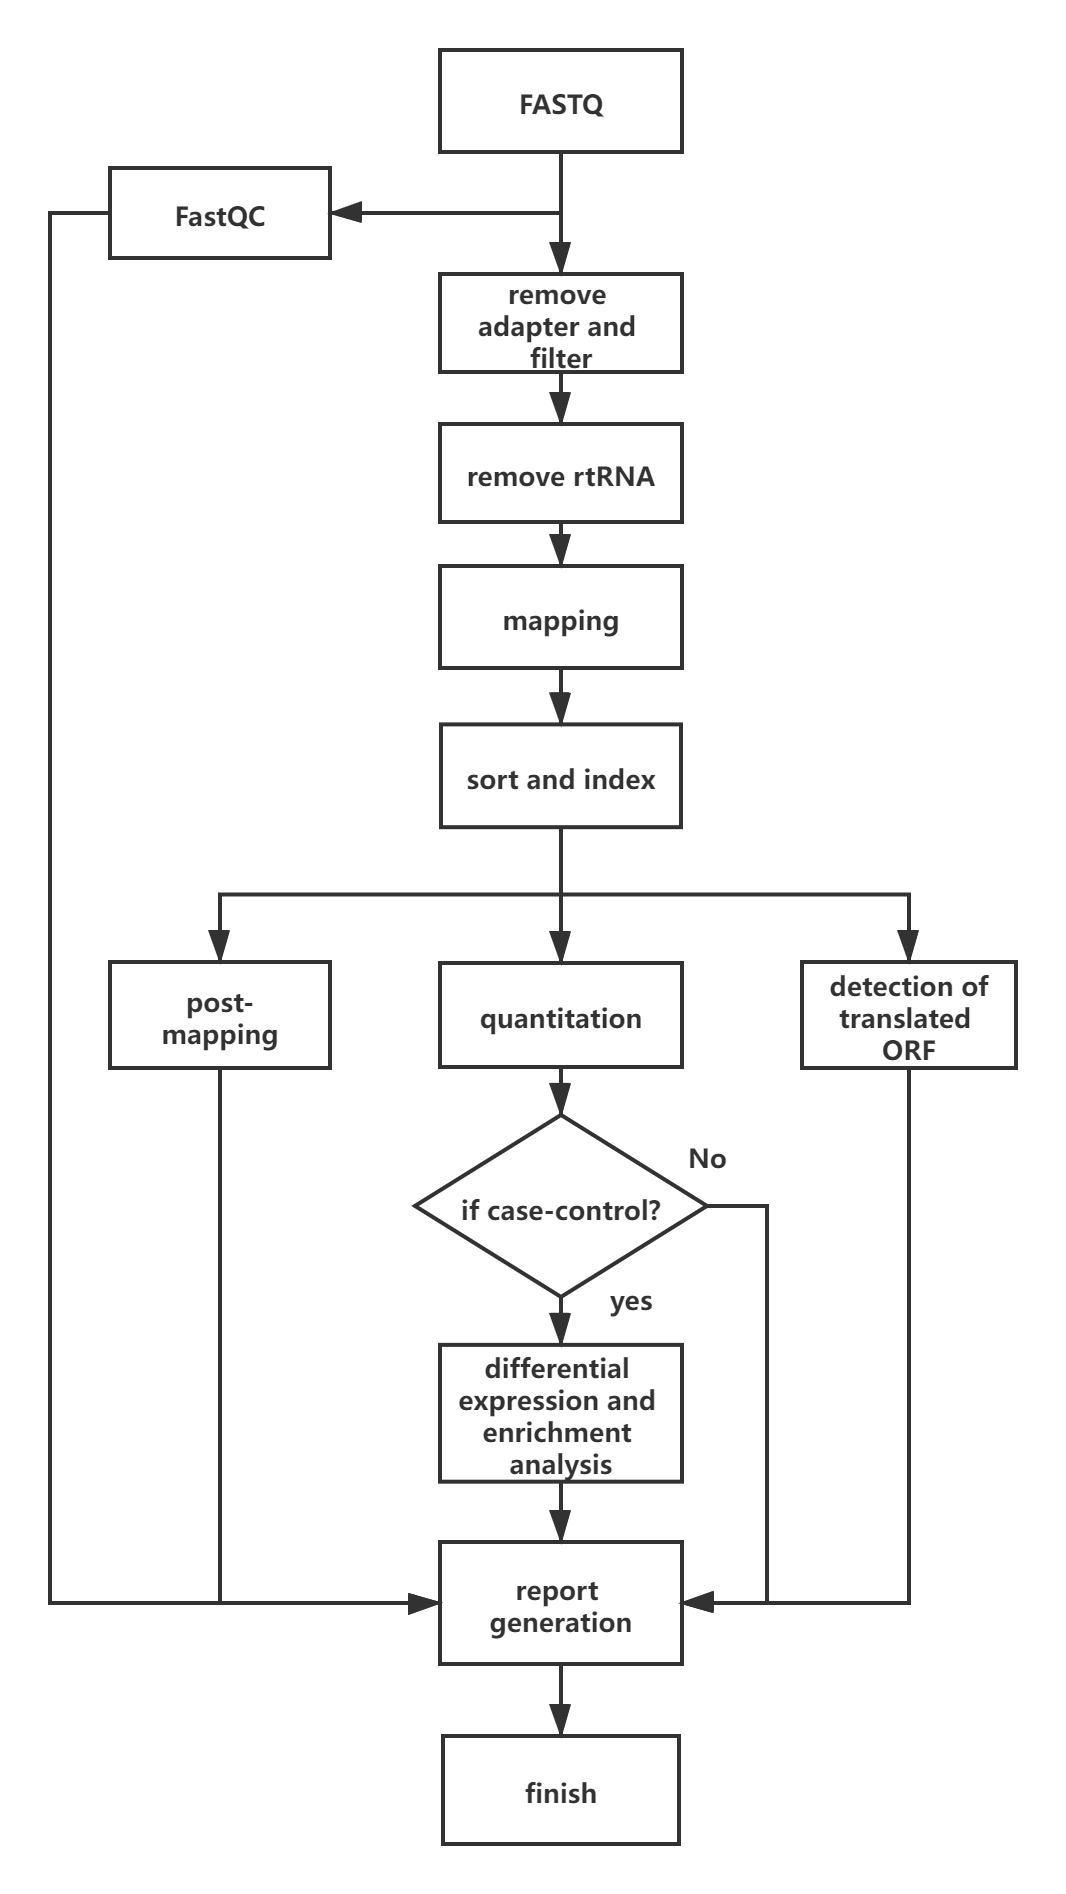
Q12. What is top-down analysis?
The pipeline is illustrated in the following figure:
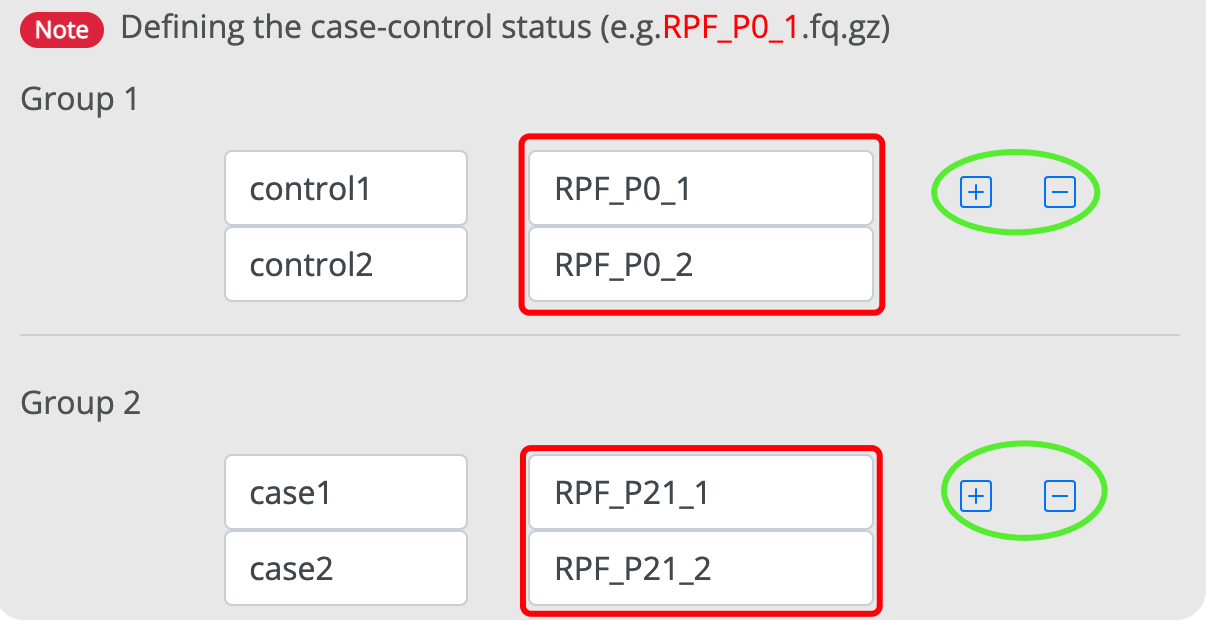
Q13. How assign the sample to different groups?
When there are multiple conditions for the uploading data, it is necessary to assign sample group status because some analytical pipelines such as differential translation analysis need to call this information. In the panel of “Defining the case-control status”, clicking on the 'plus' or 'minus' buttons to increase or decrease the rows and then entering the sample name (e.g., RPF_P0_1 and RPF_P0_2) of uploading data in the sample prefix column.
Taking demo data of 4 ribo-seq samples (that is, RPF_P0_1.fq.gz, RPF_P0_2.fq.gz, RPF_P21_1.fq.gz and RPF_P21_2.fq.gz) as an example, the sample names (RPF_P0_1 and RPF_P0_2) are filled in the Group 1 and the sample names (RPF_P21_1 and RPF_P1_2) are filled in the Group 2.
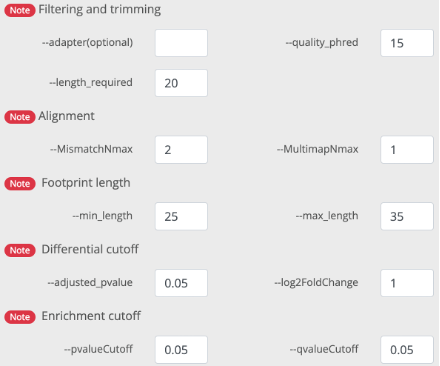
Q14. What parameters mean?
RiboChat provides a solution that allows users to modify certain parameters. Some key parameters with default values are given. Despite these default values can be changed, for a new user we do not recommend to do this. A detailed description of each parameter is summarized below.
1. filtering and trimming
adapter: the adapter sequence used for sequencing
quality_phred: minimum sequencing quality of the retained reads
length_required: the minimum length of the reads after trimming adapter and low quality bases
2. alignment
MismatchNmax: the maximum number of base mismatches per read
MultimapNmax: maximum frequency of alignment to multiple positions per read
3. footprint length
min_length: the minimum retention length of reads derived from Ribo-Seq data
max_length: the maximum retention length of reads from Ribo-Seq data
4. differential cutoff
adjusted_pvalue: Significance threshold setting for corrected p-values in differential translational efficiency analysis
log2FoldChange: threshold value for log2 transformed fold change in differential translational efficiency analysis
5. enrichment cutoff
adjusted_pvalue: Significance threshold setting for corrected p-values in functional enrichment analysis.
Q15. How to obtain the analytical result?
The user can track the results either directly, by clicking the unique identifier in the progress status report, or by clicking the URL in the task completion notification email.